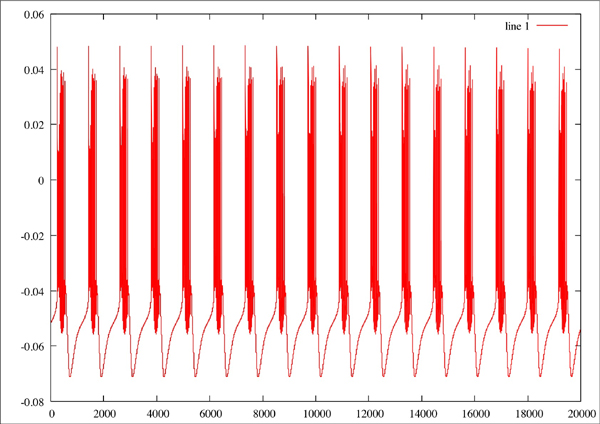
Original plot of neuron where Na=2.3, CaT = 3.33, CaS = 3.33, A = 3.4, KCa = 2.1, Kd = 4.2, h = 5, leak = 2
 Red line is the original plot, green is the estimated:
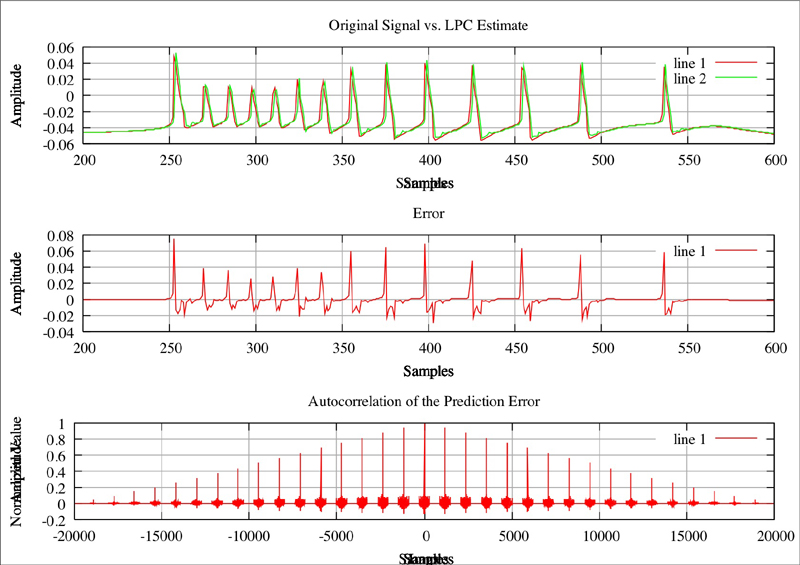 Original Plot of neuron where Na=2.3, CaT = 5, CaS = 0, A = 3.4, KCa = 2.1, Kd = 4.2, h = 5, leak = 2
 Red line is the original plot, green is the estimated:
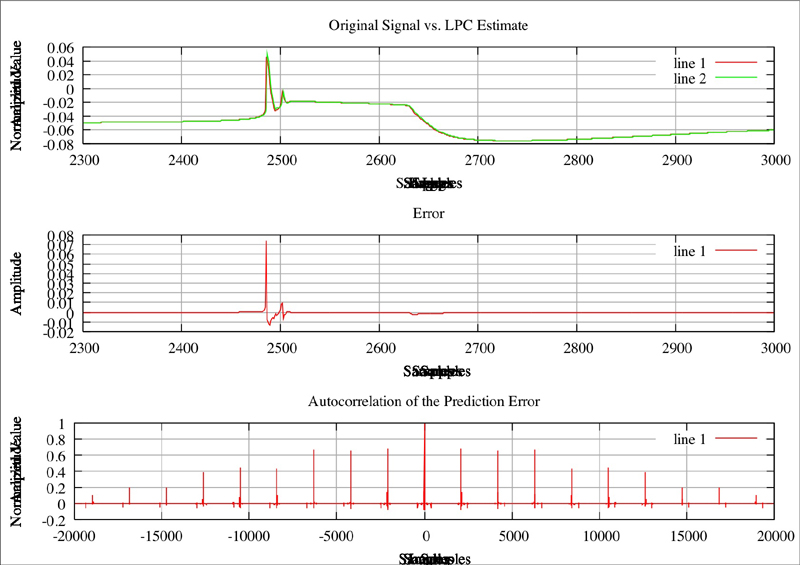 f nOriginal plor of neuron where Na=2.3, CaT = 3.33, CaS = 0, A = 3.4, KCa = 2.1, Kd = 4.2, h = 5, leak = 2
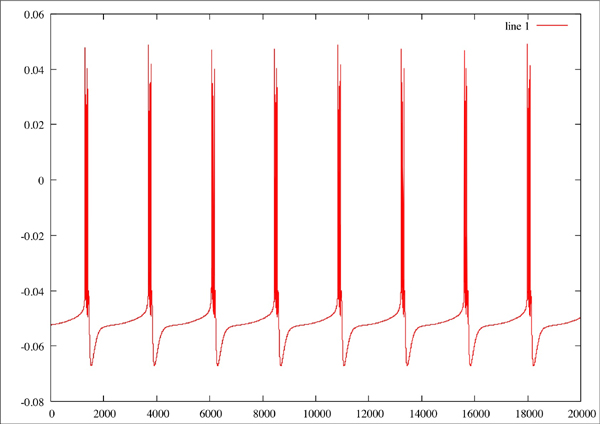 Red line is the original plot, green is the estimated:
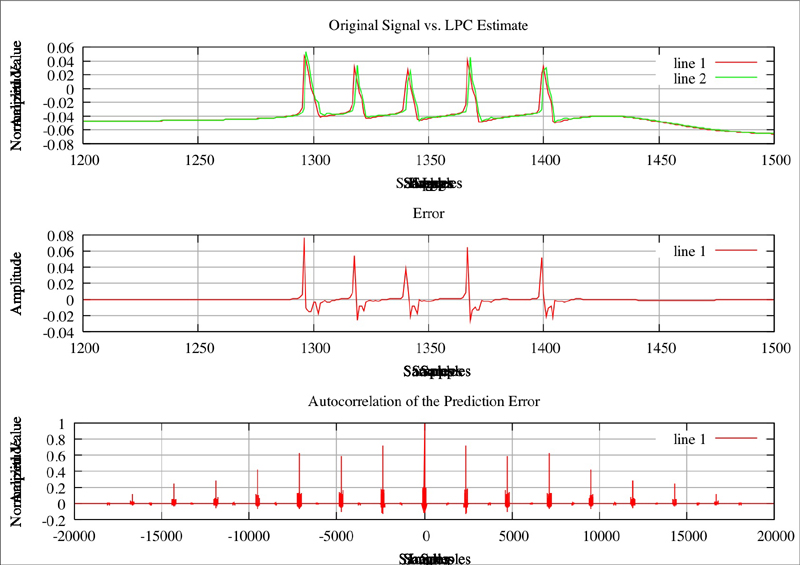

No comments:
Post a Comment